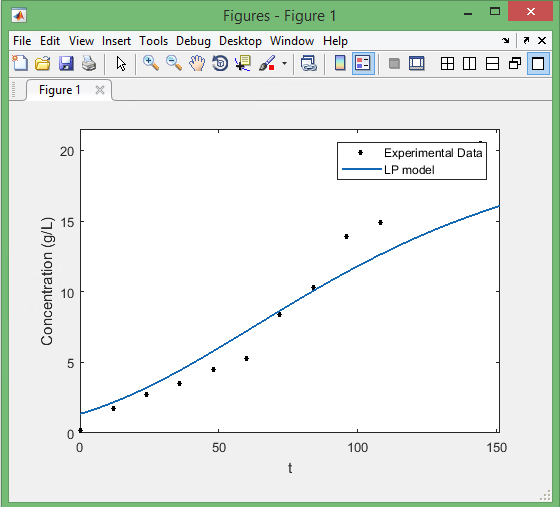
Recently, I had to deal with a set of data, some from experiments, and some obtained using MATLAB “Curve Fitting Tool”. As much as I like MATLAB figures, I usually find Excel features more desirable for good-looking plots! So, I needed to extract the data of Curve Fitting Tool. Here is what I did:
Save the figure as a “.fig” file.
Make a m-file with the following code to get the x, y data of the curve!
% Reads the figure file
f=openfig('Sina.fig');

% Gets the object of type line from the figure
h=findobj(f,'type','line');

% Obtains the "x" and "y" data of the curves
x_data=get(h,'xdata');
y_data=get(h,'ydata');
Then you have access to the data, and you can get the arrays as
% Assuming there are only 2 curves in the figure
% Gets the data as arrays

% x-values of 2 curves
x_data_curve_fit = x_data {1,1};
x_data_experimental = x_data{1,2};

% y-values of 2 curves
y_data_curve_fit = y_data {1,1};
y_data_experimental = y_data{1,2};
Then, your data is ready to copy/export to Excel.